TL;DR: Most engineering productivity metrics track outputs like commits and story points, but miss the hidden costs of context switching, tool fragmentation, and knowledge silos that drain billions in developer time. Skan AI's engineering intelligence platform captures 100% of actual developer activity across every application, giving technology executives the operational visibility to recover that lost productivity and build the data foundation their agentic AI investments require.
For technology executives responsible for engineering velocity and ROI, that visibility gap is expensive. According to Skan AI's 2025 Engineering Intelligence Executive Guide, 58% of organizations lose more than five hours per developer every week to unproductive work. For a 1,000-person engineering team, that figures to roughly $37.5 million in annual lost productivity (assuming a fully loaded developer rate of $150 per hour.)
The urgency is compounded by a wider AI investment problem. Only 6% of enterprises report meaningful positive ROI from AI programs (McKinsey State of AI, November 2025). That gap begins with incomplete operational data, and engineering productivity measurement is exactly where that incompleteness is most costly.
Why Are Engineering Productivity Metrics So Difficult to Get Right?
Engineering productivity metrics are hard to get right because each tool in a developer's stack captures only its own slice of activity, and no system connects them. The result is a fragmented picture that looks complete but misses the majority of where time goes.
Engineering teams today use an average of nine different tools daily. GitHub tracks commits. Jira tracks story completion. Slack measures message volume. But no single source captures what happens between those data points: the context switches, the repeated questions, the fragmented focus, the meeting overhead that reshapes an entire sprint before it begins.
This is the core gap that workforce intelligence platforms are designed to close. Engineering productivity metrics in most organizations are siloed by design, because the tools producing them were never built to talk to each other.
|
58%
of organizations lose 5+ hours per developer weekly to unproductive work (Skan AI Engineering Intelligence Guide, 2025)
|
94%
of businesses have critical errors in their record-keeping systems (phys.org, 2024)
|
The result is a common pattern in enterprise engineering organizations: measurement fragmentation. CTOs and CIOs can see that teams are busy. They cannot see where that effort converts into delivered business value, and where it quietly disappears.
Context Switching: The Productivity Cost Nobody Is Calculating
Context switching is the single largest and least-tracked source of engineering productivity loss in most organizations, and it scales directly with the number of tools engineers use daily.
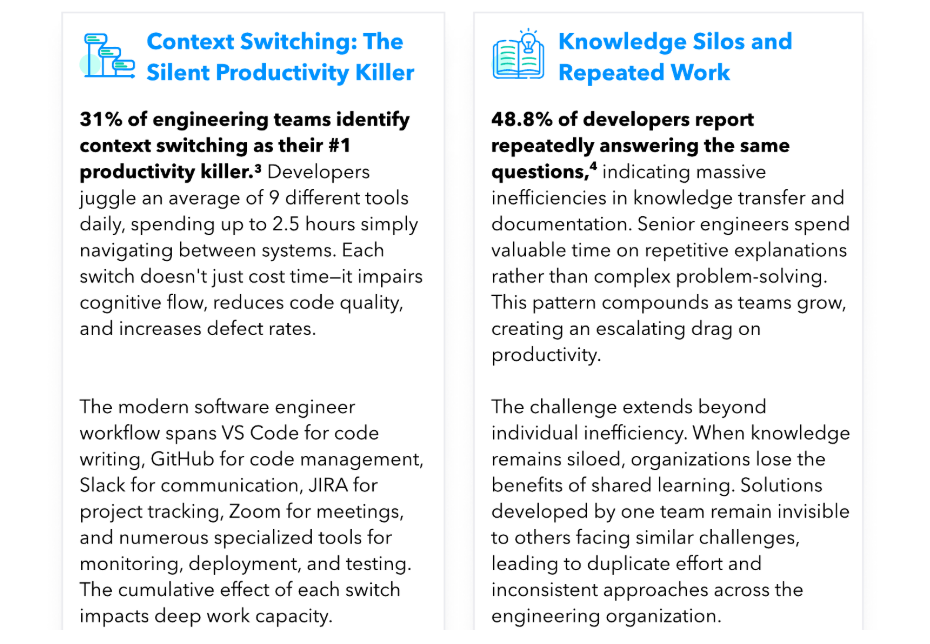
Research from UC Irvine found that the average knowledge worker requires approximately 23 minutes and 15 seconds to fully regain focus after an interruption (Gloria Mark, UC Irvine, 2008). For software engineers managing nine or more tools in a single day, this is a compounding structural drag on every hour of output.
The productivity loss compounds quickly. Code written during fragmented attention periods carries higher defect rates and demands more review cycles. That technical debt does not appear on any sprint dashboard. It surfaces weeks later, in slower delivery, more rework, and more senior engineer time diverted from complex problem-solving to repetitive explanation.
The Skan AI Engineering Intelligence Guide notes that 49% of developers report repeatedly answering the same questions, a direct signal of how knowledge silos create compounding drag. Senior engineers, the highest-cost and highest-value contributors on any team, absorb that cost disproportionately.
Where DORA Metrics and Traditional Frameworks Fall Short
DORA metrics (an acronym for Deployment frequency, Lead time for changes, Change failure rate, and Time to restore) measure the delivery pipeline, but it does not include the people and workflows inside it. That boundary is where most engineering productivity measurement breaks down.
DORA metrics are well-established benchmarks for software delivery performance and provide a useful framework for teams optimizing CI/CD pipelines. But they cannot tell you why a team's lead time is increasing. They cannot distinguish between slowdowns caused by technical debt, team communication breakdowns, meeting overload, or tool friction.
The P&L consequence is real: executives relying on DORA metrics or deployment frequency data are optimizing for the visible layer while the invisible layer, context switching, meeting overhead, knowledge silos, compounds unchecked. A team that ships consistently while burning through senior engineers is not a high-performing team. It is a retention and capability risk that no delivery metric surfaces.
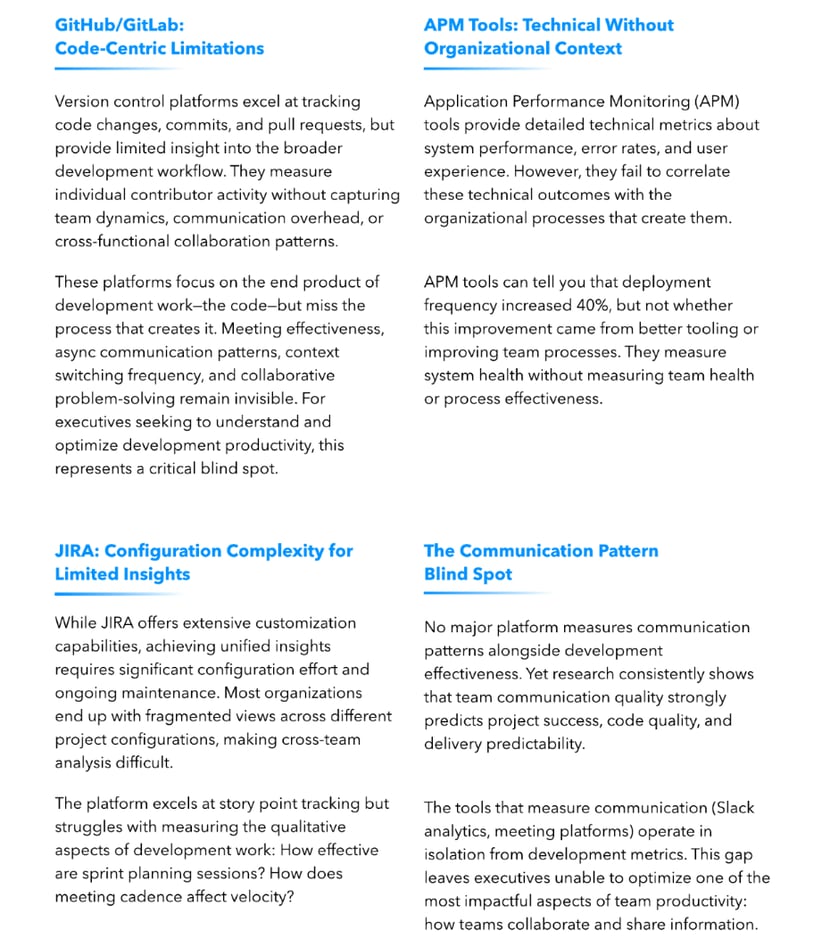
The same limitation applies to Application Performance Monitoring tools. They can report a 40% increase in deployment frequency but cannot tell you whether that improvement came from better tooling, a process change, or one high-performing team masking three that are stagnating.
|
64%
of organizations struggle to integrate collaboration tools across their development ecosystem (Skan AI, 2025)
|
10-40 days
required for manual data consolidation across productivity tools in enterprise environments (Skan AI, 2025)
|
This is the integration gap that most engineering intelligence conversations avoid. The average enterprise runs more than 660 applications. Development teams sit inside that complexity, context-switching across code repositories, communication platforms, project management systems, and monitoring tools all day. Fragmented analytics cannot produce unified insight from fragmented inputs.
Frameworks like SPACE (Satisfaction, Performance, Activity, Communication, Efficiency) take a broader view than DORA by including collaboration and well-being signals. But SPACE still depends on self-reported data and discrete surveys. Neither framework captures what is actually happening across the full application stack in real time.
What Engineering Intelligence Actually Measures
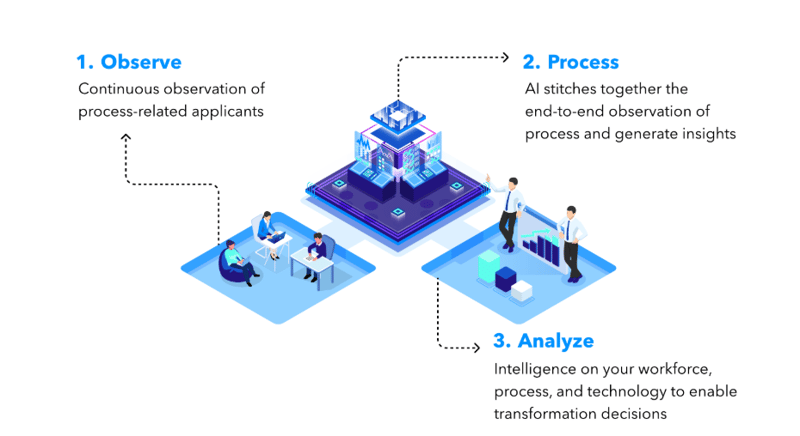
Engineering intelligence measures what system logs cannot: the full behavioral reality of how developers work, including every application, every context switch, every collaboration overhead, and every deep work interval across the complete technology stack.
The distinction from traditional tooling is foundational. Traditional process mining tools and log-based analytics capture roughly 15-20% of actual work because they only see what structured system logs record. Skan AI's desktop observation capability captures 100% of developer activity across every application, including the application switches, communication patterns, meeting time, and deep work intervals that never appear in any system log. The transition from hidden workflows to visible operational intelligence is exactly what separates engineering intelligence from traditional productivity reporting.
Skan AI's Unified Engineering Intelligence Dashboard integrates:
- Development throughput metrics from Jira and GitHub
- Activity variance across every stage of the SDLC
- Engagement metrics for development versus non-development application time
- Collaboration tool time across Slack, Zoom, and similar platforms
- Context switching patterns including copy-paste and cross-application navigation
- Analysis at engineer, team, and sprint levels
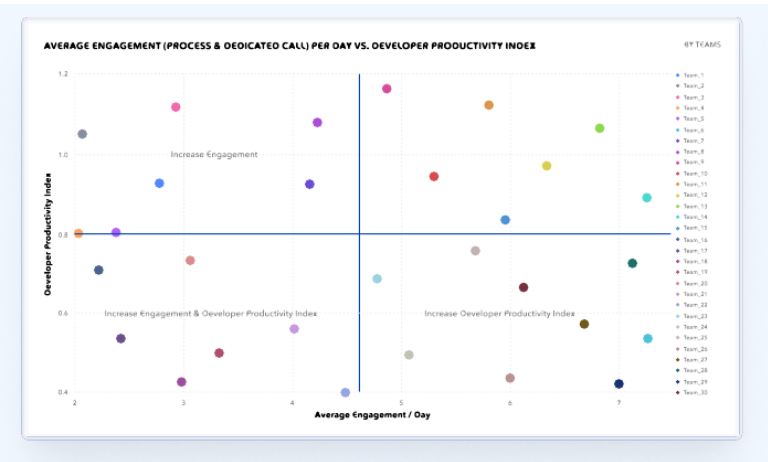
This produces a Productivity Index: a single, normalized metric that aggregates code quality indicators, collaboration effectiveness, individual deep work capacity, and process efficiency across the full development lifecycle. It is the kind of measurement that allows a CIO to answer questions that fragmented tooling cannot: which teams are operating most efficiently, which development practices correlate with faster delivery, and where the highest-value process investments are.
The Business Case for Unified Engineering Productivity Measurement
The ROI framework for engineering intelligence investment is straightforward to model. Skan AI's Engineering Intelligence Guide walks through a worked example for a 1,000-person development organization:
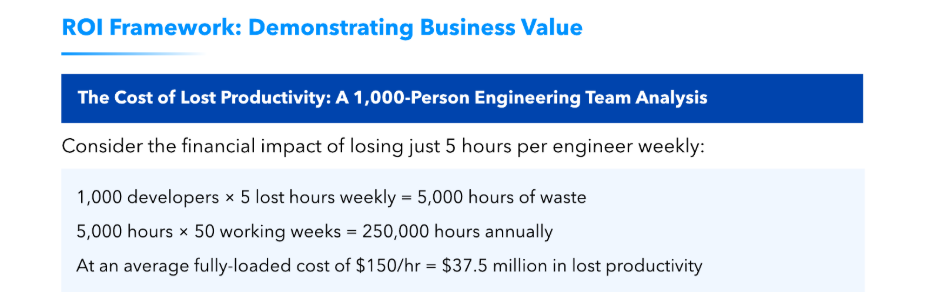
A 20% reduction in wasted time, a conservative target for organizations that implement unified process visibility, translates to $7.5 million in recovered productivity annually against a platform investment of approximately $500,000. That is a first-year ROI of 1,400%.
The calculation represents direct costs only. It excludes delayed product releases, technical debt from fragmented work, engineer burnout and turnover costs, and the competitive cost of slower innovation cycles. Each of those has its own multiplier effect on the original figure.
How to Measure Engineering Productivity: A Practical Starting Point
Most engineering productivity improvement initiatives stall at the baseline assessment stage. Organizations know their current metrics are incomplete but lack a clear method for establishing what complete measurement looks like. A structured approach resolves that by sequencing observation before optimization.
The first phase, foundation and integration, covers the first two months. The goal is technical integration with existing development tools and the establishment of baseline measurements before any process change begins. Optimizing without a baseline produces activity, not improvement.
The second phase, analysis and pattern identification, runs through months three and four. This is where the data starts producing insight: workflow optimization pilots, process improvement identification, and the first correlation analysis between communication patterns and delivery outcomes.
The third phase, optimization and scaling, applies what the data reveals across the broader organization. Process improvements scale to all teams. Advanced analytics generate predictive insights. ROI measurement documents what changed and compounds the initial investment.
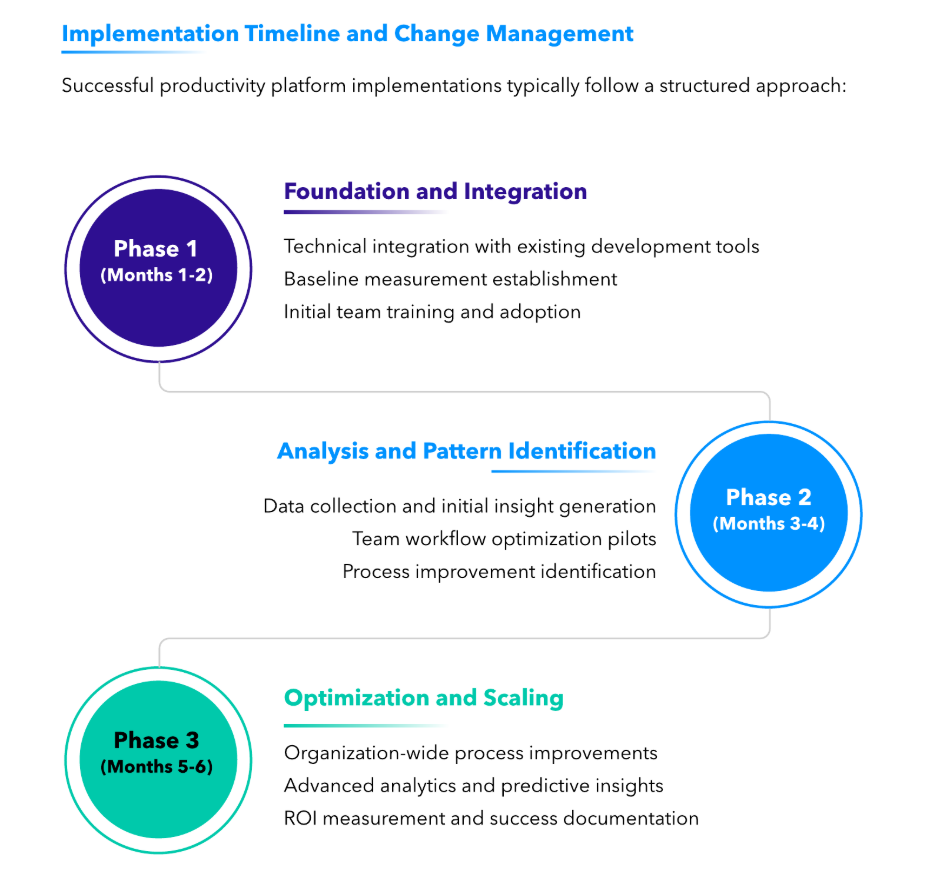
The sequencing matters. Organizations that attempt to optimize before establishing observational baselines are making decisions with the same incomplete data that created the productivity problem in the first place.
