TL;DR: Operations leaders at Fortune 500 enterprises report that AI and automation investments are delivering far less efficiency gain than projected. The problem is that traditional automation tools capture only 15 to 20 percent of actual operator activity. The remaining 80 to 85 percent of work, and most operational inefficiencies, happen where no system log or dashboard reaches.
What Is Workforce Intelligence?
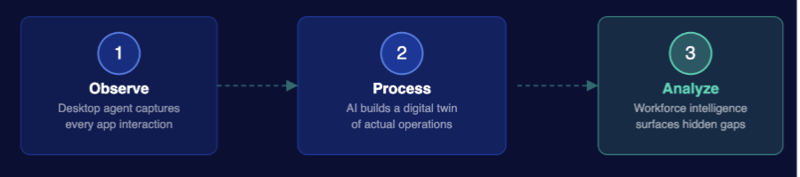
Plain-language definition: Workforce intelligence is the continuous, AI-powered observation of how work is performed at the desktop level. It answers a precise question: how is work actually happening, step by step, across every application and every team? Every application interaction, process step, and timing pattern is captured, giving operations leaders an accurate picture of what their workforce is doing, not what reporting tools say they are doing.
Unlike conventional workforce analytics tools that rely only on self-reported data or system logs from integrated platforms, workforce intelligence captures the full picture of work. This includes time spent in each application, process variations between employees, idle time, rework, and manual steps that would otherwise remain invisible to management.
Why Do Hidden Inefficiencies Stay Hidden?
Most operational inefficiencies persist because performance measurement tools are tracking outputs, not processes. Dashboards report tasks completed, SLAs met, and cases closed. They do not report the path taken to reach those outcomes.
Think of it like a GPS that shows you arrived on time but has no record of the 12 detours and wrong turns along the way. The outcome looks fine, but the journey tells a different story.
Work telemetry, the continuous capture of how employees interact with applications and tasks at the desktop level, is what finally makes those detours visible. Enterprises using work telemetry consistently discover operational waste that was entirely absent from their existing reporting infrastructure.
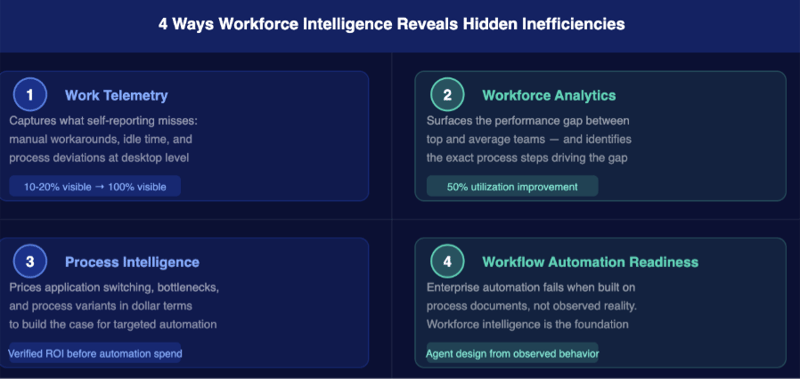
1. How Does Work Telemetry Capture What Self-Reporting Misses?
Work telemetry captures what self-reporting misses because it observes work as it happens, not as employees remember it afterward. Employees typically underestimate time spent on routine tasks and overestimate the complexity of edge cases.
Skan AI's observation agent runs continuously at the desktop level, capturing every application interaction, click sequence, and process transition across every operator. This creates an accurate digital record of work that is independent of any interview, survey, or system log.
The operational findings are specific:
- Manual workarounds become visible. Employees working around broken or slow systems do so silently. Work telemetry shows the exact step where the workaround occurs and how frequently it happens across the team.
- Idle time and wait states are measured accurately. Time lost to system lag, application loading, or unstructured downtime appears in the data, not just in anecdotal complaints to operations managers.
- Process deviations are quantified. When a new procedure is implemented, work telemetry confirms whether it has been adopted and identifies where the gaps remain.
Event-log-based tools capture 15 to 20 percent of actual operator activity. Work telemetry closes that gap to a complete view of desktop operations, including every application, every workaround, and every step that generates no system record.
2. How Does Workforce Analytics Surface the Real Performance Gap Between Teams?
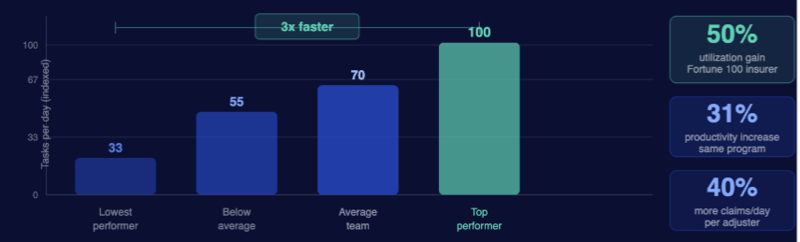
Workforce analytics reveals the performance gap between teams by making the difference between top and average performers visible in the process data, not just in output metrics. This distinction matters because the gap is almost never about effort.
In enterprise operations, the highest-performing team typically completes the same tasks two to three times faster than the lowest-performing team. That difference is explained by process: the top team has discovered a faster application sequence, a more efficient routing path, or a set of steps that avoids unnecessary rework. That path has never been documented or replicated.
Workforce analytics from Skan AI identifies precisely which steps, sequences, and application patterns the top performers are using. Operations leaders use that data to:
- Replicate the top-performer workflow across the broader team through structured process standardization
- Create targeted training based on observed skill gaps, not assumptions made in a training needs workshop
- Set performance benchmarks grounded in what the best teams demonstrably do, rather than what process documentation assumes they should do
See how Skan AI maps workforce performance gaps and surfaces top-performer practices across your operations. Explore Workforce Productivity
3. How Does Process Intelligence Put a Price Tag on Application Switching?
Process intelligence identifies the real cost of application switching by measuring how much time is lost each time an employee moves between tools, and what that adds up to at scale across the operation.
Application switching is one of the most common and least-measured sources of operational friction in enterprise environments. An employee handling a claims case, a KYC verification, or a loan origination may move between eight, ten, or twelve different applications to complete a single transaction. Each transition takes seconds. Across thousands of operators, it consumes hours of productive capacity every day.
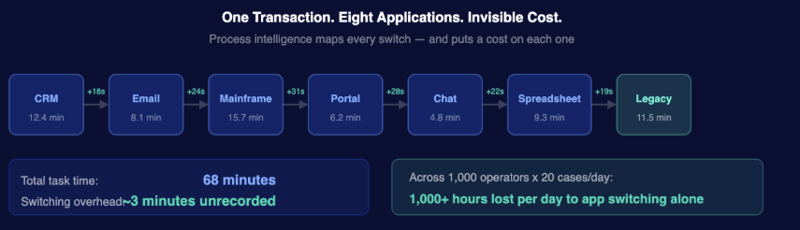
Process intelligence maps this friction across three dimensions:
- Application usage analysis identifies which tools are consuming time relative to the value they deliver, and highlights candidates for consolidation or replacement
- Variant analysis compares the actual sequence of steps taken by different employees for the same process, revealing where non-standard paths are adding time and creating compliance risk
- Bottleneck identification pinpoints the specific steps where cases slow down or stall, providing a precise target for redesign or automation
This data creates the business case for technology investment, process redesign, or targeted automation by showing exactly where the cost is and how much it is worth to eliminate it.
4. Why Does Enterprise Workflow Automation Stall Without Workforce Intelligence First?
Enterprise workflow automation stalls at the design stage when the automation is built on an inaccurate picture of how the process actually runs. Most automation projects begin with documentation created through interviews and workshops. That documentation reflects how the process was intended to work, not how it works today.
For the COO or Chief Transformation Officer running an enterprise agentic AI program, workforce intelligence is not an optional diagnostic. It is the prerequisite that determines whether the program delivers on the board's expectations. Without it, the program becomes part of a growing list of stalled investments.
Workforce intelligence changes those odds in two specific ways:
- Agent design is generated from observed human behavior, eliminating the need to manually define agent characteristics for complex processes such as claims adjudication, mortgage origination, or KYC
- Post-deployment monitoring confirms whether automation is performing as designed and surfaces the steps where human fallback is still occurring
Skan AI's context graph captures the decision trace behind every human action: every exception path, every application touch point, and every routing decision. As enterprises scale their agentic AI programs, the operational ground truth generated from desktop-level observation becomes the foundational data layer every autonomous agent needs before a single automation is deployed.
Understanding first. Automation second.
What Are the Key Benefits of Workforce Intelligence for Enterprise Operations?
The four capabilities work together as a connected system that converts hidden inefficiencies into addressable operational outcomes.
|
Capability
|
What It Uncovers
|
Business Outcome
|
|
Work telemetry
|
Manual workarounds, idle time, process deviations not in any system log
|
Accurate operational baseline; elimination of invisible waste
|
|
Workforce analytics
|
Performance gaps between top and average teams; unshared best practices
|
Top-performer workflows replicated; $28M+ savings identified
|
|
Process intelligence
|
Application switching costs, process variants, bottleneck locations
|
35% to 40% cycle time reductions; targeted technology ROI
|
|
Workflow automation readiness
|
Actual vs. intended process design; exception paths and human fallback points
|
Higher automation success rate; agent design from observed behavior
|