Blogs
Oct 2, 2024

Your employees are drowning in Excel.
Right now, someone at your company is copying data between spreadsheets for the third time today. Another person just spent 20 minutes reformatting a report they'll have to redo tomorrow. A third employee is manually entering numbers that could be pulled automatically. This isn't just happening once. It's happening thousands of times across your organization every single day. Skan AI identifies the Excel bottlenecks most organizations overlook, quantifying the hidden productivity drain from manual spreadsheet work and showing where automation delivers the fastest return.
Here's what most companies don't realize: Excel work that looks productive on the surface often hides massive waste underneath.
We've seen teams spend 40% of their time on repetitive Excel tasks that could be automated. We've found companies where simple application switching between Excel and other systems costs millions per year.
The problem isn't Excel itself. The problem is not knowing where the real bottlenecks are.
Our process intelligence platform can observe all applications, so we can create the most complete view of process work. Application usage is a big part of how we help companies become more efficient.
Time and time again, we see how "productivity" apps like Excel, Notepad, Teams, Word, etc hurt more than help. Excel is such a versatile application, so it's almost always near the top of application usage reports.
Let's look at the common ways we see Excel working against productivity optimization efforts from real-world use cases.
What We Uncover: Skan AI consistently reveals that teams spend excessive time manually extracting data from core applications into Excel spreadsheets, creating significant operational bottlenecks that remain invisible to traditional analysis methods.
The Opportunity: When these patterns are exposed, organizations can implement automated data extraction and report generation workflows to eliminate these manual processes.
Real-World Discovery: For a Fortune 100 US health insurance provider, our platform uncovered that teams were spending valuable hours in Excel. They were manually copying data into spreadsheets simply to validate information already available in their core applications. This insight enabled the organization to implement solutions that delivered $15 million in savings, allowing employees to focus on processing claims rather than time-consuming data entry tasks.
What We Uncover: Our process intelligence technology reveals substantial variations in how teams use Excel across different locations, with processing time for identical tasks varying by as much as 3x-variations that often remain hidden from traditional process analysis.
The Opportunity: By identifying "trendsetters" within organizations-employees who process cases faster than their peers-organizations can implement these best practices across teams.
Excel performs many functions, but these are the few we see most often:
Real-World Discovery: When analyzing a medical management department's Risk and Quality Assessment processes, we discovered teams spending an average of 25% of their time in Excel, with significant regional variations. This visibility enabled the organization to standardize Excel practices. They reduced Excel usage from 25% to just 5% across regions, and identified opportunities to save 2.5 million labor hours (equivalent to 800 full-time employees). This led to $27 million in savings for this department.
What We Uncover: Our platform quantifies precisely how often employees toggle between applications, revealing that workers switch to/from Excel dozens of times per case in complex workflows. This creates substantial cognitive load and process inefficiency that remains invisible to process mining tools.
The Opportunity: Organizations can standardize Excel as the primary application for specific tasks and reduce copy-paste actions through targeted process redesign.
Real-World Discovery: For a Fortune 100 P&C insurance carrier, we identified significant inefficiencies, with underwriters averaging 47 toggles to and from Excel per case. This visibility enabled the organization to implement targeted standardization, reducing copy-paste actions from an average of 12 per case to just 7, resulting in a 45% reduction in processing time for renewals and approximately $12 million in annual savings.
What We Uncover: Skan AI finds teams often spend anywhere between 25-40% of their processing time in Excel, frequently on repetitive, low-value tasks that could be automated, far more time than organizational leaders typically realize.
The Opportunity: With this visibility, organizations can implement targeted automation of specific high-value, repetitive Excel tasks without requiring wholesale system replacements.
Real-World Discovery: For a business services company in the background screening industry, our platform identified numerous Excel processes that could be automated or streamlined. This visibility enabled the organization to implement changes that delivered $5.8 million in estimated annual savings from improved processing efficiency, plus an additional $7.2 million in annual savings from automation initiatives.
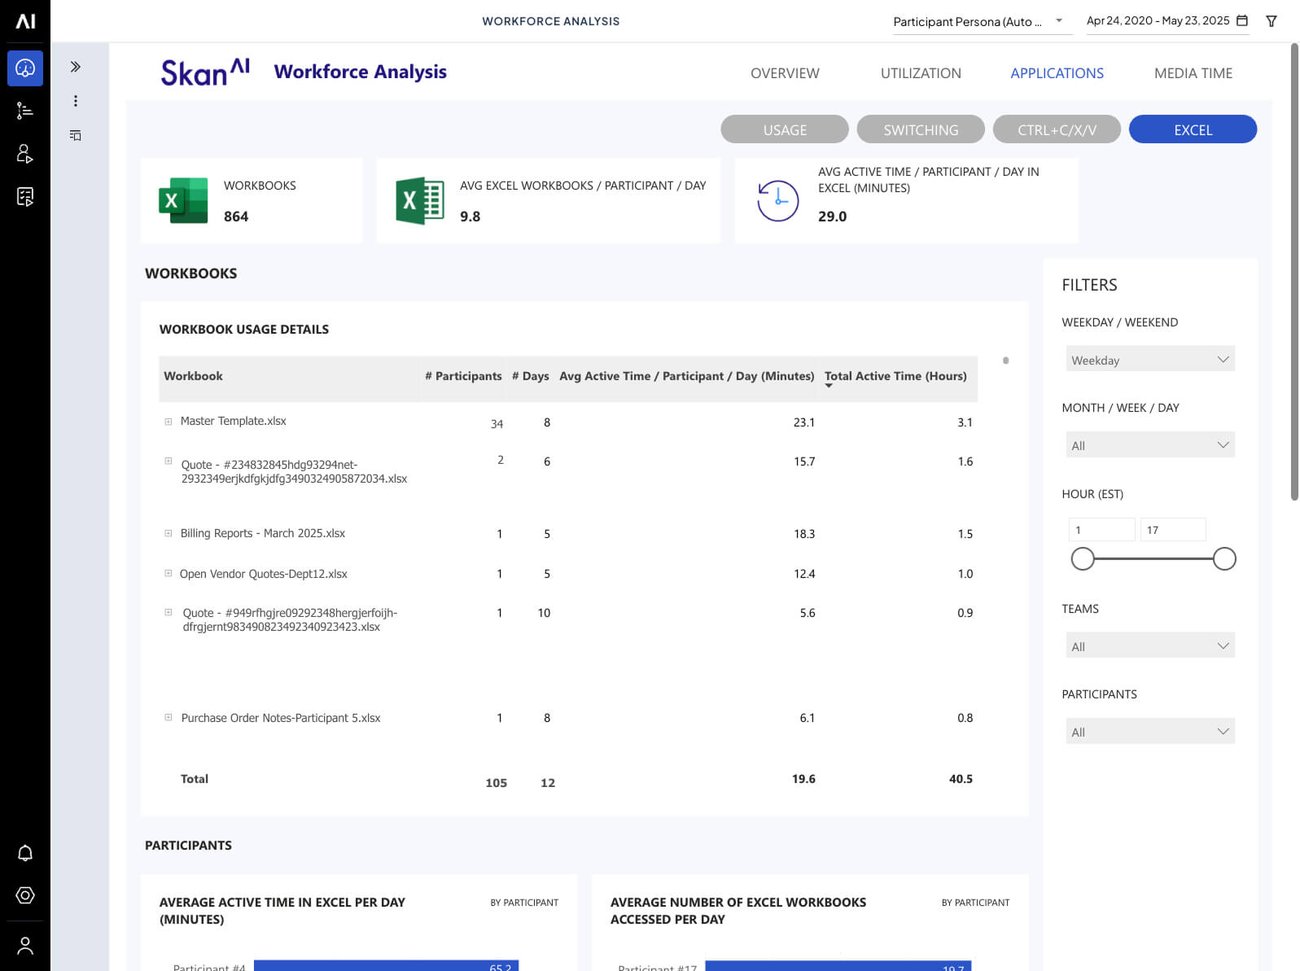
How many workbooks are in use
Avg workbooks used by day
Impact on active time
Each individual worksheet within a single Excel file
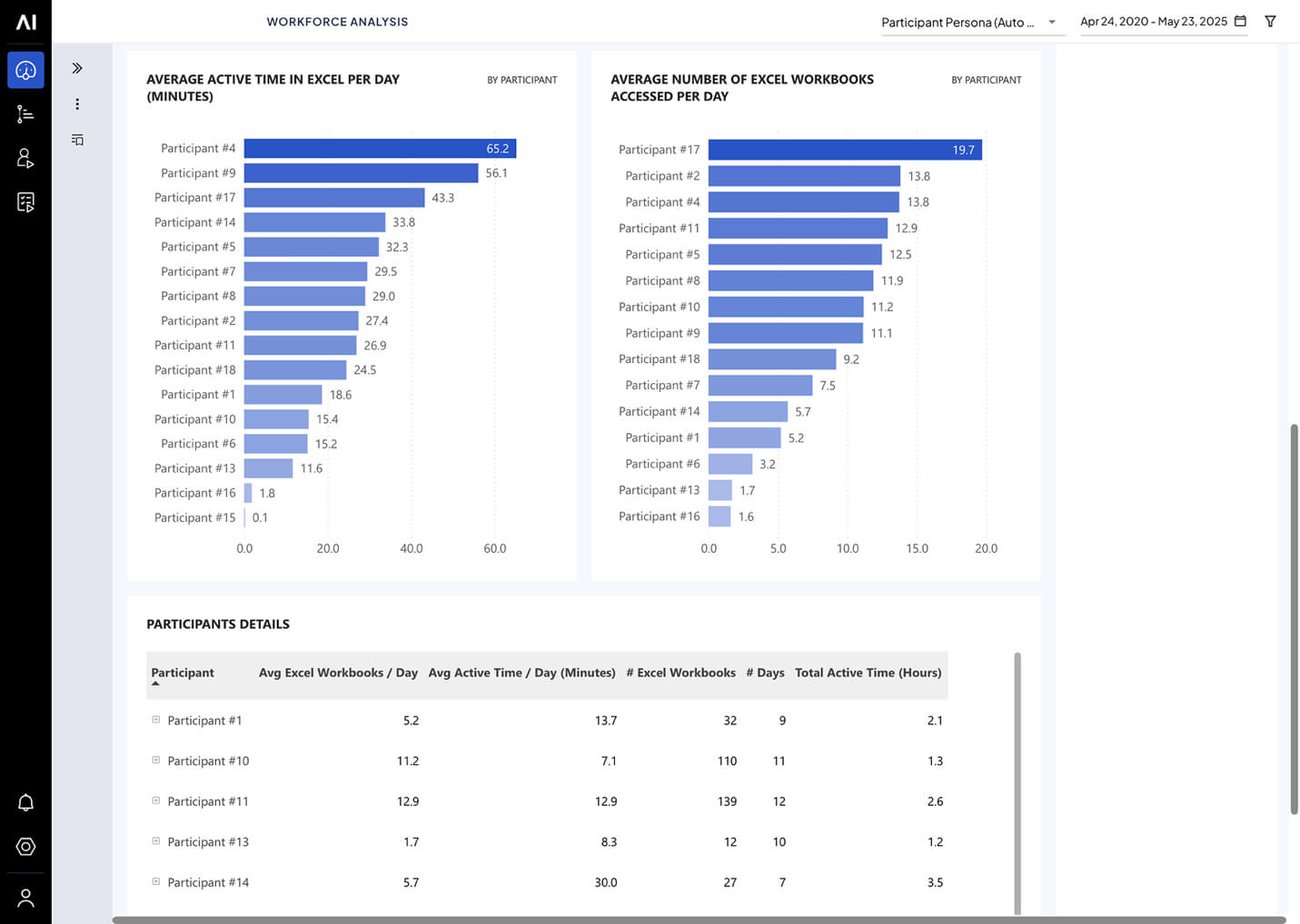
How individual participants are using Excel
PRIVACY NOTE: Skan AI can mask users and create groups for reporting, so individual identities can always be hidden through anonymization or grouping.
Our process intelligence technology has revealed several essential patterns about Excel usage that apply across industries:
Our process intelligence platform has helped organizations identify substantial, documentable savings opportunities across enterprises:
Read these are more in our Case Studies section.
If your organization experiences high Excel usage, significant application switching, or process variations across teams, our process intelligence platform can help identify millions in potential savings opportunities. We don't implement solutions—we provide the visibility and insights you need to make informed decisions about optimization.
Discover the value hidden in your spreadsheets, waiting to be revealed.